A conceptual understanding of Linear Regression Analysis is a prerequisite for this article. Thus, we recommend you to visit this link if you need more clarity. Let’s begin!

Evaluation Metrics of the Classical Linear Regression Model:
Before understanding the metrics to assess model performance, let us understand why do we even need them?
A performance metric is an important part of regression because it checks the reliability of a model. It gives you a value that can be used to describe the error associated with the predictions made by a model.
In this article, we will be discussing 3 metrics for linear regression:
- Mean Absolute Error, MAE
- Mean Squared Error and Root Mean Squared Error, MSE and RMSE
- Coefficient of Determination, the concept of R2 and adjusted R2
Mean Absolute Error:
Have you heard about mean deviation? The concept of MAE is analogous to the mean deviation. In MAE, we take the average of absolute deviations of the predicted values from the actual values.
Thus, MAE gives you a measure of how much the predictions made by your model deviate on an average in absolute terms.
Calculation of MAE:
Where yj is the jth observation, yj cap is the jth observation as predicted by the model and n is the sample size.
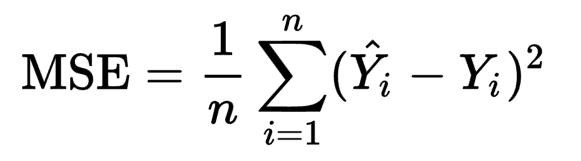
Mean Squared Error and Root Mean Squared Error:
Mean Squared Error (MSE) is analogous to the standard deviation. MSE is calculated as the average of squared differences between the actual value and the predicted values of the model. MSE penalizes large differences even more by squaring them.
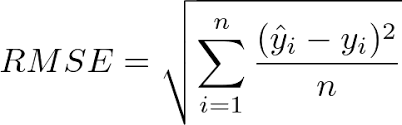
However, MSE is not on the same scale as the dependent variable (y). To overcome this drawback, there exists the concept of Root Mean Squared Error (RMSE). RMSE is calculated by taking a square root of MSE thus bringing back the metric to the same scale. Hence, RMSE is more widely used.
Coefficient of Determination:
Coefficient of determination measures the proportion of variability explained by the model. The idea is to partition the total variability in the dependent variable into two parts: variability due to the regression model and variability due to the error (residual).
i.e. SS(Total) = SS(Regression) + SS(Residual)
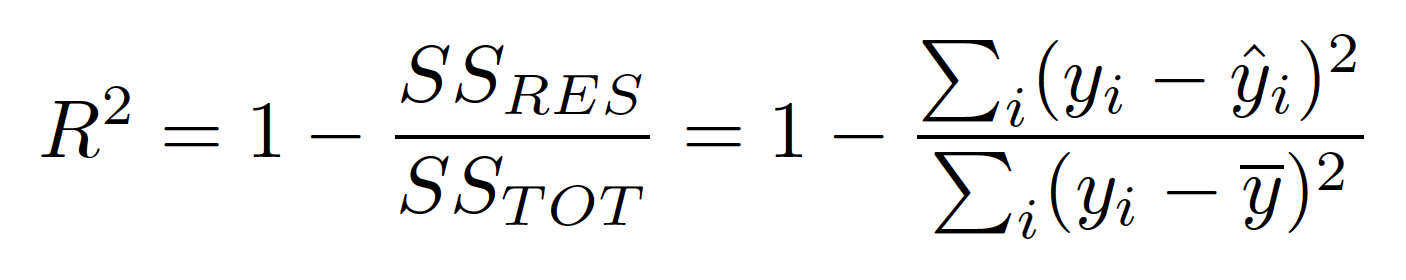
On observing closely you would notice that SS(Total) is nothing but the variance of the dependent variable (y).
However, the addition of an explanatory variable almost always leads to an increase in the value of R2, that is, R2 is a non-decreasing function of a number of regressors. Therefore, we use adjusted R2 which takes into account the number of predictors in the model. We divide both SSE and TSS with their degrees of freedom. Thus, the adjusted R2 adjusts for the number of parameters in the model.
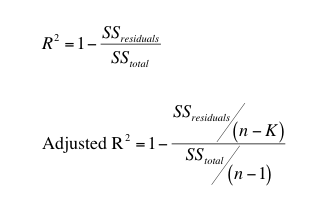
Here, n is the sample size and k is the number of estimated parameters (number of regressors+1, since we estimate an intercept term as well)
For any query, suggestion or feedback, please reach out to us on LinkedIn or schedule a meeting by vising the Contact page. You can find some of the resources that helped us here.
If you can contribute by talking about your interview experience, it will definitely create an impact. Please fill this form to help students get a perspective about the interview structure and questions.
You can read other articles here.
Cheers and Best!